FromCova Software Team ([email protected])
Subject (72)4/20 Retail Sales Infographic: See How Much Dispensaries Made (And Lost)
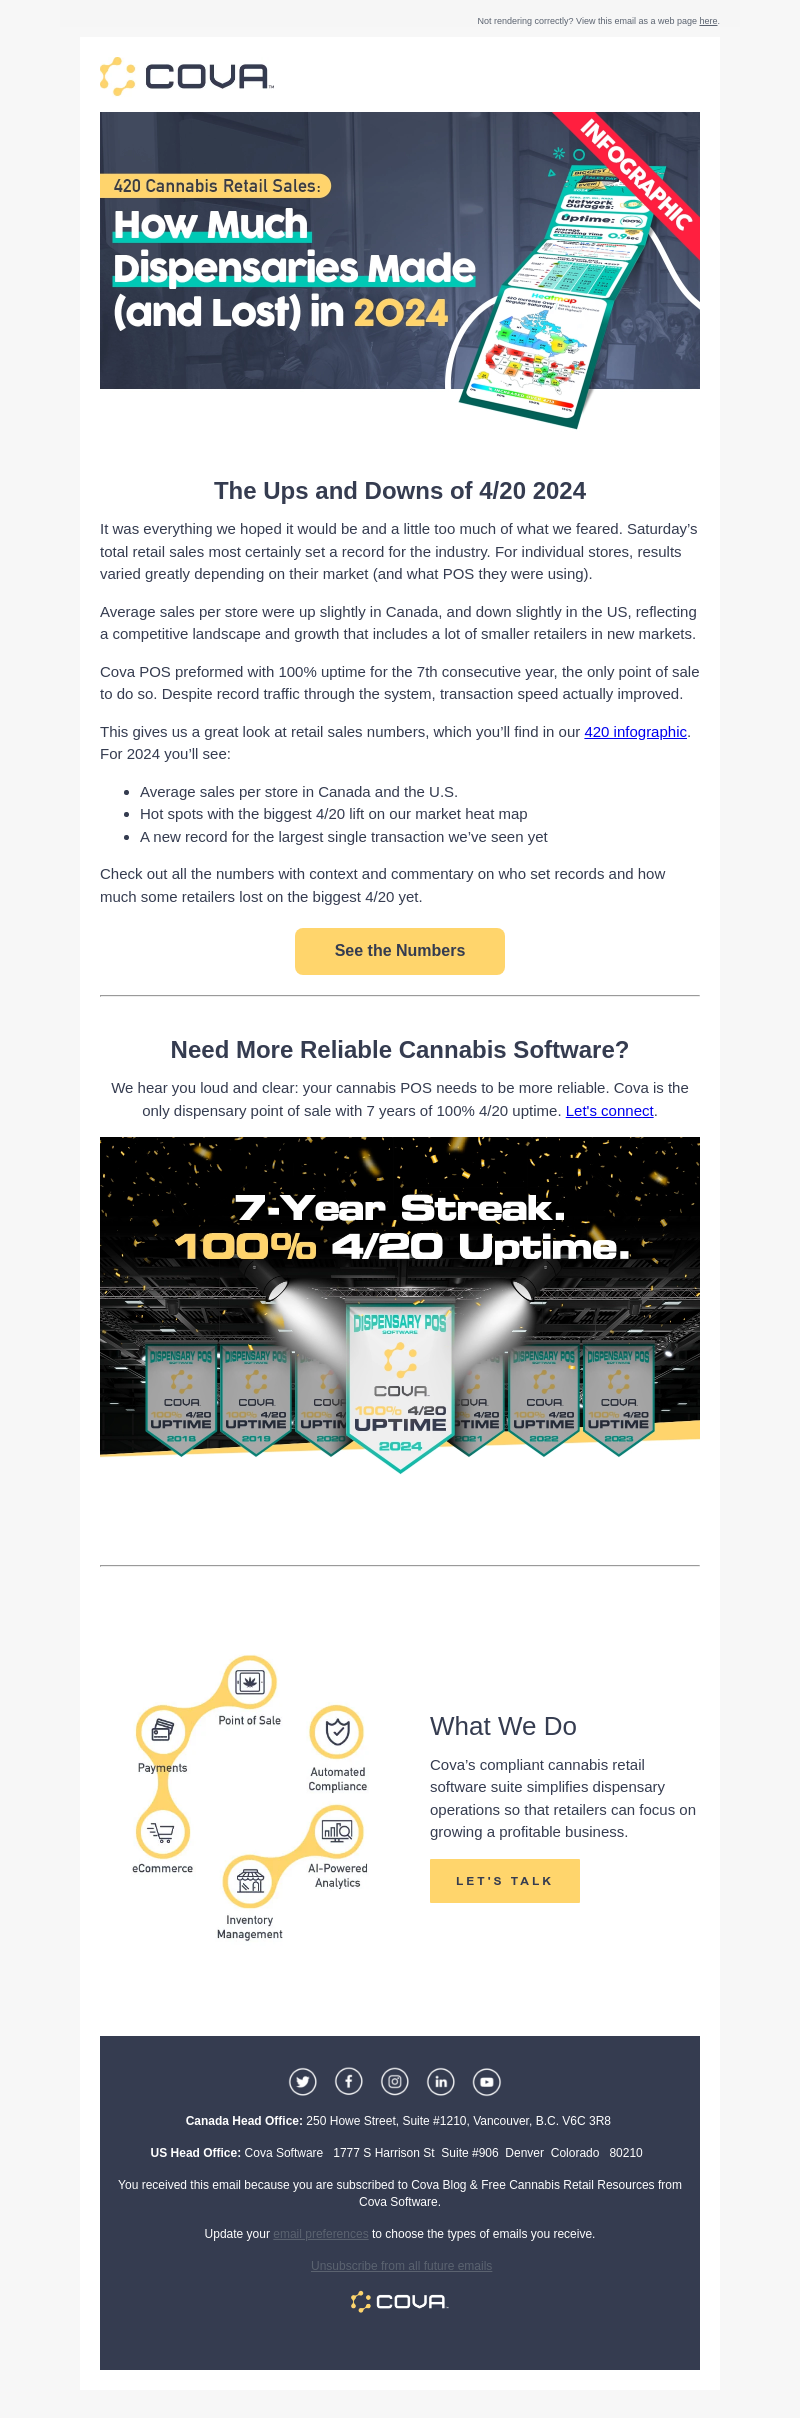
Preheader (127)4/20 by the numbers: average sales per store, which markets saw the biggest spike, and where the biggest transactions happened.
sans
Text Analysis
Body Words1236
Subject Words11
Body Emojis1
Subject Emojis
Media Analysis
Text Links6
Image Links8
Total Links14
Images13
Technical Metrics
Performance
HTML Size, Kb
Pixel Length, px2418 px
X-Spam Score-0.1
Preheader OptimizedNo
Timing
Day of WeekFriday
TimeEarly Morning